
Helping Hands Foundation

MOST DONATION CAMPAIGNS FAIL BEFORE THE FIRST AD RUNS
Most people think donation campaigns fail because of budget. Spend more, reach more people, write a more emotional caption — and the money follows. That assumption is wrong, and it is expensive.
When we started working with Helping Hands Foundation, we did not see a budget problem. We saw a cause genuinely worth funding — real impact, real beneficiaries, a team that cared deeply about the work. What we also saw was near-zero infrastructure to convert that goodwill into actual donations.
That gap — between a meaningful cause and the systems needed to fund it — is where most NGOs quietly lose donor intent. Not because people do not care. But because the path from “I want to give” to “I gave” is broken, invisible, or simply not built.
Over 60 days, we built that infrastructure from scratch. Here is exactly how we thought about it — and what the numbers showed.
WHAT WE FOUND WHEN WE AUDITED THE SETUP
Before writing a single ad or setting a rupee of budget, we audited three things: the website, the tracking stack, and the prior campaign data.
The website existed. It told the organisation’s story. It had a donate button. But it was built like an about-us page — informational, not transactional. An informational site assumes the visitor already trusts you. A conversion-focused site understands that most visitors arrive with interest, not conviction, and that trust must be built on the page itself before the ask.
The tracking stack was incomplete. Meta Pixel was installed, but the Conversion API was absent. That gap means campaigns optimise on only a fraction of actual conversion data. Every budget decision, audience selection, and creative test is made using an incomplete picture.
The prior campaign data confirmed it. Cost per payment on the early campaigns sat at ₹175.61 and ₹193.07. Not catastrophic — but a clear sign of inefficiency caused by poor data visibility. Later, the cost per result on the scaled Advantage+ campaign dropped to ₹85.48. That difference was not a creative breakthrough. It was a data quality story.
WHAT WE BUILT — AND WHY IN THIS ORDER
1. Website and Landing Page Optimisation
We restructured the donor journey around a single question: what does a first-time visitor need to see, read, and feel before they are willing to enter their card details?
The answer is not more information. It is a specific sequence — credibility signals first, then emotional resonance, then a frictionless ask. Every additional step between intent and completion reduces conversion rates. We simplified the flow, shortened the form, and made the CTA impossible to miss.
This work came before any ad spend. Sending paid traffic to a poorly converting page is not a traffic problem. It is a funnel problem that advertising only makes more expensive.
2. Meta Pixel + Conversion API (CAPI) Setup
We implemented the full dual-tracking stack: server-side Conversion API alongside the browser-side Pixel, with custom events tied to every meaningful donor action — page visit, donation initiation, completion, thank-you page view.
→ Browser Pixel alone misses 30–60% of conversions due to iOS privacy restrictions
→ CAPI sends conversion data server-to-server, bypassing browser limitations entirely
→ Better data quality = sharper algorithm training = lower cost per donation
→ The CPR drop from ₹175.61 → ₹85.48 across this campaign is largely a data quality story
Setting up the tracking stack is unglamorous work. Nobody posts screenshots of their CAPI event
configuration. But it is the foundation every other optimisation sits on — and skipping it means every rupee of ad spend works with a handicap.
3. Creative Strategy — Specificity Over Sentiment
Donation campaigns are fundamentally different from e-commerce campaigns. You are not selling a product or offering a personal benefit. You are asking someone to part with their money for a cause larger than themselves. That requires a completely different creative strategy.
Our guiding principle was simple: specificity beats sentiment. Generic appeals such as “Children are suffering. Please help.” may generate sympathy, but they rarely create urgency. Specific stories, clear numbers, and tangible outcomes help donors understand exactly what their contribution will achieve—and why it matters right now.
We tested across static images, short-form videos, and carousel formats because donor behaviour is not uniform. Different age groups and giving histories respond to different messages. The creative that resonated with a 45-year-old professional was often very different from what motivated a 28-year-old first-time donor. Understanding those differences allowed us to match the message to the audience and improve overall campaign performance.
THE NUMBERS — WHAT THE DATA SHOWED
Campaign-Level Metrics Overview
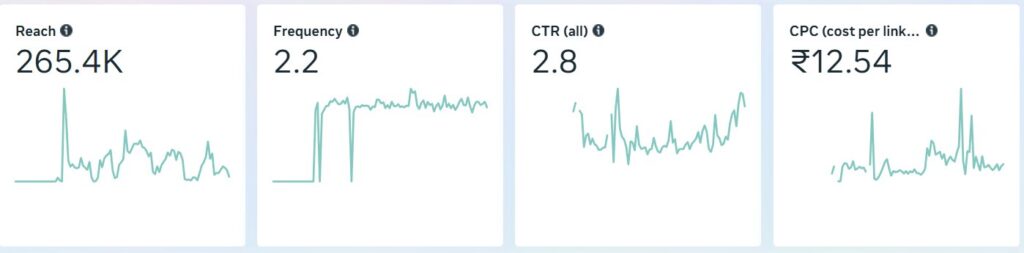
A CTR of 2.8% for a donation campaign is strong. Industry benchmarks for social cause campaigns sit between 0.8% and 1.5%. A 2.8% rate means the creative is stopping people mid-scroll and making them want to know more. Frequency of 2.2 is the right zone — below 1.5 you rely on a single impression; above 3.5 fatigue sets in. CPC of ₹12.54 against a donation value that needed to exceed ₹56 per click to sustain 4.5X ROAS meant the campaign ran at a healthy efficiency margin throughout.
Campaign Performance Breakdown
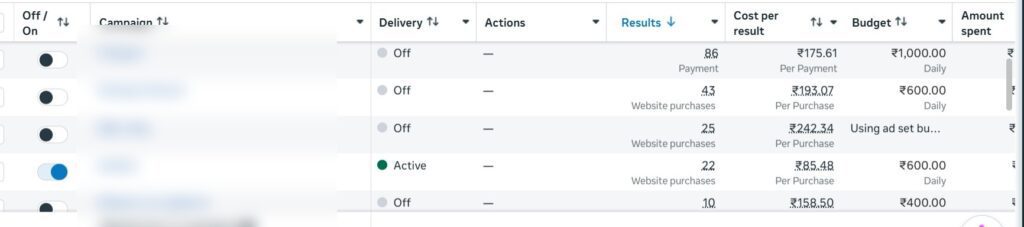
Reading the cost-per-result column in sequence tells the story of how structured testing produces
compounding efficiency.
| Campaign | Objective | Results | Cost / Result | Budget | Note |
|---|---|---|---|---|---|
| Campaign A (Off) | Payment | 86 | ₹175.61 | ₹1,000/day | Early baseline |
| Campaign B (Off) | Website Purchase | 43 | ₹193.07 | ₹600/day | Audience test |
| Campaign C (Off) | Website Purchase | 25 | ₹242.34 | Ad set bdgt | Creative test |
| Campaign D (Active) | Website Purchase | 22 | ₹85.48 | ₹600/day | Best CPR — scaled |
| Campaign E (Off) | Website Purchase | 10 | ₹158.50 | ₹400/day | Broad/no-audience |
The scaled Advantage+ campaign achieved ₹85.48 cost per purchase — less than half the cost per result of the first campaign. The improvement is not just creative. It is the algorithm trained on clean CAPI data, finding the donor cohort that earlier tests mapped out.
Budget Architecture — Why CBO at Scale
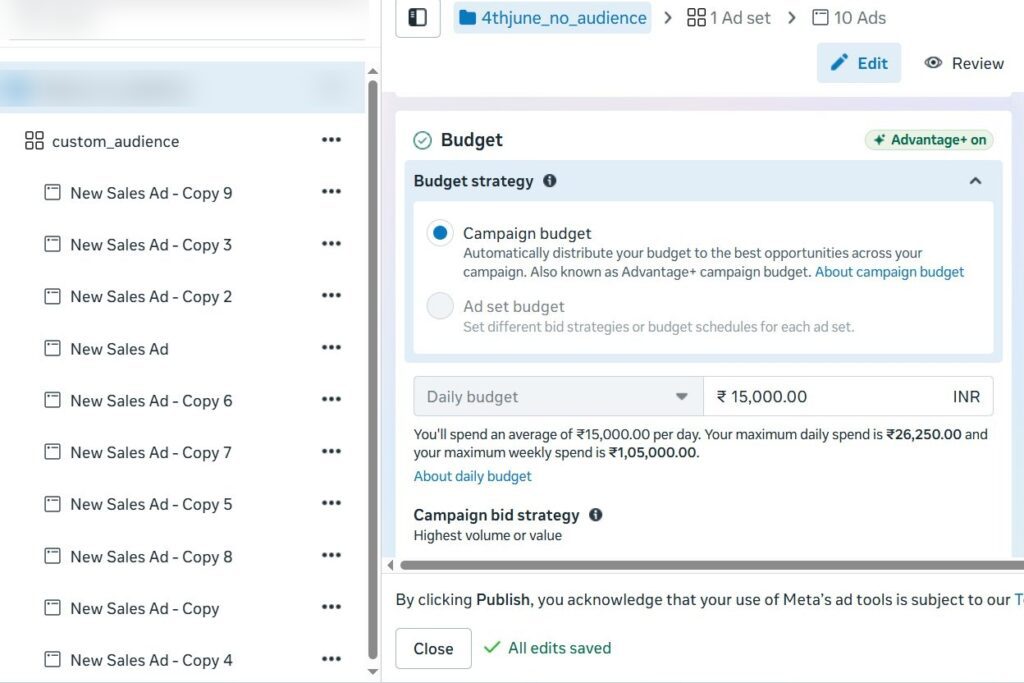
→ CBO distributes spend dynamically to highest-performing opportunities in real time
→ Maximum daily spend ₹26,250 | Maximum weekly spend ₹1,05,000
→ Donor intent clusters around specific time windows — CBO captures them; rigid budgets miss them
→ Highest Volume bid strategy appropriate for cause campaigns with variable donation amounts
Ad-Level Spend Distribution
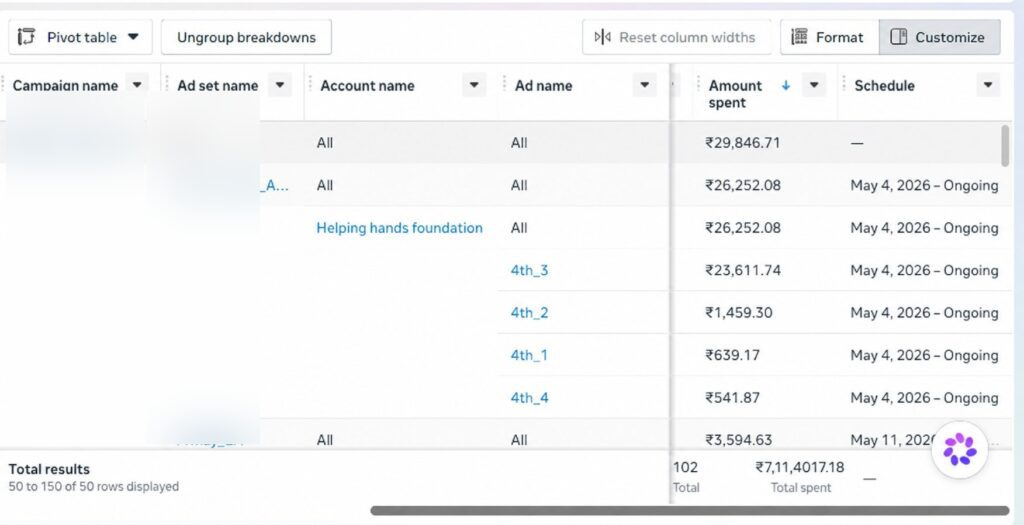
Within the primary campaign, one ad absorbed approximately 90% of the budget — ₹23,611.74 — because it was outperforming the other three on every metric. The remaining three received ₹1,459.30, ₹639.17, and ₹541.87 respectively. This is CBO working correctly. You do not manually shift budget to the winner. You structure the campaign so the algorithm identifies and rewards it.
VERIFIED: PAYMENT GATEWAY CONFIRMATION
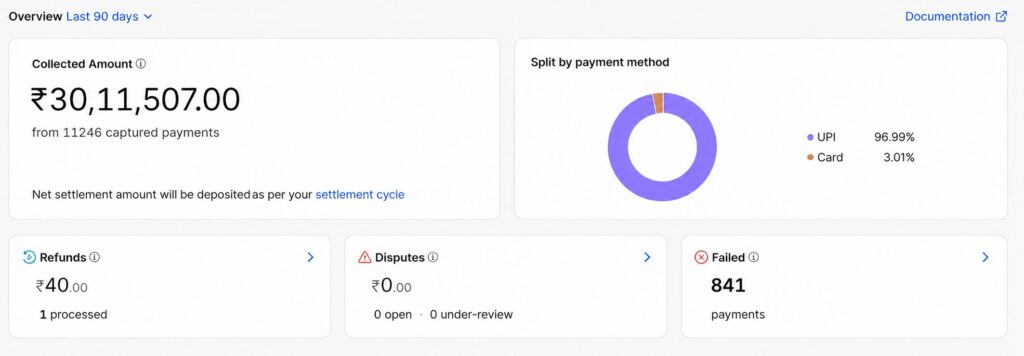
Every number in this case study is verifiable. The figure below is pulled directly from the Razorpay dashboard
— ₹30,11,507 collected from 11,246 captured payments, zero disputes.
₹30,11,507
Collected Amount
Razorpay — verified
11,246
Donor Transactions
Captured payments
₹0.00
Disputes
Zero chargebacks
96.99%
Paid via UPI
Mobile-first audience
96.99% of donors paid via UPI. That is not just a payment method data point — it tells you exactly who the donor audience is: mobile-first, making decisions quickly. The creative and landing page strategy was built for this behaviour — fast-loading, frictionless, UPI-first checkout.
Zero disputes across 11,246 transactions means the donor journey was clear enough that nobody felt deceived or confused. Trust, maintained all the way to the payment confirmation screen. One ₹40 refund on a single transaction — compared to 2–5% refund rates in typical performance campaigns — is as clean as it gets.
RESULTS SUMMARY
| Metric | Result |
|---|---|
| Donations Collected (Razorpay) | ₹30,11,507 — verified |
| Total Donor Transactions | 11,246 captured payments |
| Return on Ad Spend (ROAS) | 4.5X |
| Total Unique Reach | 2,65,400 people |
| Click-Through Rate (CTR all) | 2.8% (industry avg: 0.8–1.5%) |
| Cost Per Click (CPC) | ₹12.54 |
| Ad Frequency | 2.2 (optimal for trust-building) |
| Best Cost Per Purchase | ₹85.48 (started at ₹175.61) |
| CPR Improvement | 51% reduction over campaign period |
| Payment Disputes | ₹0.00 — zero chargebacks |
| Dominant Payment Method | UPI — 96.99% of transactions |
| Campaign Timeline | 60 days (May – June 2026) |
| Total Campaigns Tested | 13 |
| Tracking Stack | Meta Pixel + CAPI (dual attribution) |
| Budget Strategy | CBO · Advantage+ · Highest Volume |
WHAT THIS CAMPAIGN ACTUALLY TAUGHT US
Donors are not a different species from customers. Same psychological wiring — trust before they transact, specificity before they commit, frictionless path between intent and action. What is different is the emotional register. The trigger is not desire or status. It is empathy, urgency, and moral identity.
Attribution matters more in nonprofit than in e-commerce. When an NGO makes the case to its board that digital marketing is worth the investment, they need clean data. Pixel-only tracking that misses 40% of conversions does not just affect campaign optimisation — it affects institutional confidence in the entire channel.
Scaling is not about increasing budget. It is about increasing signal quality. When the algorithm has clean data, the right creative, and a validated audience, scaling spend increases results proportionally. When any one of those three things is missing, scaling spend just accelerates waste.
11,246 people chose to donate. Not because the ads were louder. Because the story was specific, the experience was frictionless, and the tracking was clean enough that the algorithm kept finding more people exactly like them.
Services Delivered
| Service | What It Delivered |
|---|---|
| Website Development & Optimisation | Rebuilt donor journey for conversion |
| Meta Pixel Implementation | Full custom event tracking setup |
| Conversion API (CAPI) | Server-side attribution accuracy |
| Meta Ads Management | 13 campaigns · structured testing |
| Content & Creative Development | Emotional storytelling · multi-format |
| Performance Marketing Strategy | Audience hypothesis → test → scale |
| Funnel Optimisation | Landing page + donation checkout flow |
| Audience Testing | Broad · Lookalike · Advantage+ variants |